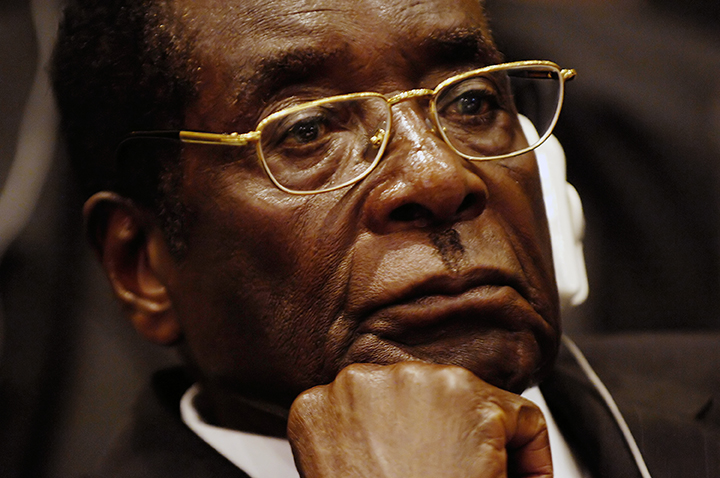
President of Zimbabwe Robert Mugabe in Addis Ababa, Ethiopia, January 31, 2008. (U.S. Air Force photo by Tech. Sgt. Jeremy Lock)
Data analysis shows that the longer current heads of state rule, the higher the levels of corruption and the more extensive their powers become
It is, unfortunately, not unusual to hear of a head of state staying in power beyond the constitutionally prescribed term, and Africa has no shortage of current and historic examples. But to what extent is length of rule on the continent associated with overstaying the constitutional term, and is there a point at which length of rule becomes too long? In short, how long is too long?
Data related to specific heads of state is not easy to find. This is possibly because heads of state are individuals, and obtaining data on individuals is not the sort of thing that economists feel comfortable with. Moreover, heads of state are not the kinds of people who make information about their personal lives freely available.
Still, there is some publicly available data that can be used to provide some initial answers to the question. For the purposes of this study, we have looked at the time heads of state have spent in power, measured in years. We limited our data to include only those heads of state who ruled after the country’s independence. So, Ethiopia, for example, was excluded.
In addition, for our data set we obtained years in power for current and past heads of state since independence. To add some substance to these measures, we also obtained data relating to the number of years of independence, the number of heads of state since independence, and the length of time since the longest ruling head of state left power.
Adding these variables, we thought, would enable us to address some interesting questions. Could it be that the longer ago a long-term ruler has been in power, the less of an impact their rule has on the current country situation? For after all, the effect of long rule might be mediated by time. On the other hand, could it be that the longer a head of state clings to power, the more of an impact their rule has on the current country situation? For the longer they ae in power, the more time they might have to seek personal benefits from their period in office, to the detriment of their country.
Figure 1

So we measured the proportion of time a long ruler was in power relative to the total time a country had been independent. Country conditions were represented in a range of variables, covering poverty, state fragility, corruption measures, size of legislature and cabinet, economic processes and aspects of human rights, among others. A full list is provided in Appendix A.
It must be emphasised that this investigation is only an initial exploration. Outcome data for Africa was only available for 19 countries. This small sample size precluded attempts at advanced modeling. However, we felt that if our initial investigation revealed interesting results, this could be revisited. At any rate, our data included a majority of numerical data; the head of state-related data was made up of years (since independence and time in power).
We ran simple correlations between these and the various (numerical) country variables. We used R software, and generated plots of correlations (corrplots).
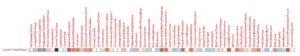
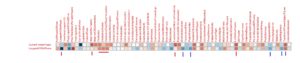
Figure 1 represents all correlations across all variables. The head of state variables are along the left hand side, while the head of state variables and country condition variables are along the top. Reading across from the head of state variables on the left, any darker red or blue indicates a possible relationship between an aspect of head of state and the corresponding variable. The graph as a whole shows that there are only a few strong correlations, marked either red or blue. Most are weaker reds and blues – not strong enough to be important – or white – indicating no correlation.
This graph is useful because it provides a quick overview of the whole set of relations between variables in our data. However, it is complicated, and needs to be broken down into manageable subsections.
Figure 1 is the first, left hand section, of Figure 1, which comprises the first seven variables in the horizontal axis, and represents the correlation of the head of state-related measures with themselves.
These are the number of heads of state since independence (NoOfHeadsOfState), the length of time the country’s longest ruling head of state was in power (LongestHOSInPower), the length of time since the longest ruling head of state was in power (TimeSinceLongestHOS), the proportion of the longest ruling head of state time versus the length of time that a country has been independent (PropLongestHOSvIndTime), the proportion of time since the longest ruling head of state versus the length of time that they served (PropTimeSinceVPeriodInPower), the years that a country has been independent and the current head of state’s length of time in power.
Figure 2

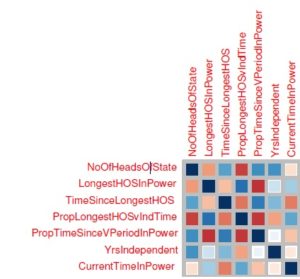
Looking at this subsection of the graph, we find few very surprising correlations. Most variables relate to each other the way we would expect them to. However, one interesting result is that more recently independent countries have fewer heads of state staying in power for long periods. This might suggest that there was a period when longer ruling heads of state were more common, and that they became less so with time.
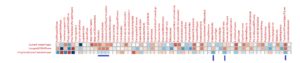
Figure 3 gives an idea of the effect of time in power of the current head of state on the country conditions. There are a number of dark red squares; most intensely so at AbsenceOfCorruption, DontUsePublicOfficeForPrivateGain, and LimitedGovPowers. This seems to indicate that as current heads of state stay in power for increasing lengths of time, corruption increases (or absence of corruption declines).
Related to this, the longer the head of state stays in power, the more they use public office for private gain (or their use of public office for private gain decreases). And finally, increased heads of state’s length of ruling time is related to fewer limits of government power. So essentially, the longer current heads of state rule, the higher the levels of corruption, and the more extensive their powers become.
Figure 3
What about former heads of state? Might these have an impact on a country’s current conditions? It seems reasonable to consider this, given that some current heads of state might have “inherited” country conditions from a former long-term ruler.
It might be, for instance, that an instance of long-term occupation of the role of head of state in the past still exerts an influence on a country’s current conditions. To address this question, Figure 4 adds LongestHOSInPower to the graph. LongestHOSInPower represents the number of years that the country’s longest ruling head of state was in power.
Figure 4
When considering this, historical head of state, corruption and the use of public office for personal gain are no longer relevant, while several issues related to civil justice are. In addition, reduced rights, increased state fragility and increased external interventions increase.
Considered as a whole, this suggests that historical long ruling heads of state leave a legacy of structural damage that continues to be felt in the current country context. This is the case even where the current heads of state play a more honest game, and there are lower levels of corruption and lower levels of using public office for their private gain. The directionality of the correlation also suggests that not only do these relationships exist, but that the longer the historical head of state rules, the deeper the structural damage to the country.
Figure 4 suggests a relationship between a historical long ruling head of state and the current country situation. The longer the head of state ruled, the bigger the impact on certain current country conditions. But what about the mediating effect of time? Does this impact reduce with the passage of time? To address this question, figure 5 adds PropTimeSinceVPeriodInPower to the graph. PropTimeSinceVPeriodInPower represents the proportion of time since the longest ruling head of state versus the length of time they were in power.
Figure 5
Some positive correlations appear, suggesting that as time passes, the negative impacts of long ruling heads of state diminish. These include some issues relating to civil justice, which are mildly positively influenced.
They also include some rights, such as freedom of expression, as well as transitions occurring subject to the rule of law. With time, fewer factionalised elites are evident, and fewer demographic pressures.
Less encouraging is the continued presence of illicit financial flows – and with a strong positive relationship there is some evidence that these actually increase with time. This seems to tie in with the previous analysis of current heads of state becoming more corrupt with more time in office; the illicit financial flows may point toward their involvement.
Overall, however, the results seem to suggest that the further countries leave long ruling heads of state in the past, the more they recover in most respects.
The previous analysis has provided some indication that the longer heads of state rule, the more they seem to
be involved in personal corruption,
and the worse the country conditions become. It also suggested that countries can recover, over time, from the effects of a long-ruling head of state. But what exactly would count as a long ruling head of state? How long is too long?
The previous analysis indicates that the longer heads of state rule, the more they seem to be involved in personal corruption.
A definitive answer to this question will require more space than is available here. But it is tempting to take a look at our data. We can obtain some idea of this issue by plotting the length of time rulers ruled against some important outcomes. Let’s look at those most closely associated with heads of state in our previous analyses: corruption, expanding government powers and using public office for private gain.
Graph 1 shows the relationship between time in power and the use of office for private gain and absence of corruption.
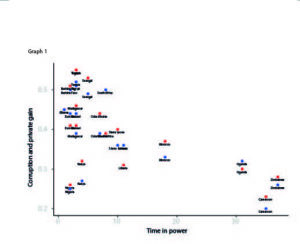 The downward slope, indicating an increase in the latter, is evident. Bearing in mind the limitations imposed by the small sample size, it is evident to some extent that there are no high scores beyond around eight years. This might point toward a maximum constitutionally mandated term in office, with an average of eight years. It might be that heads of state who stay in power beyond this threshold are very prone to corruption.
More data might populate this graph more effectively, and fill in some of the blank space in Graph 1, between heads of state with less than ten years’ rule from those with 30 years or more – Cameroon, Zimbabwe and Uganda.
So how long is too long? Before answering the question, we need to reiterate that there are some important caveats to this research. A small sample size means a large possibility for error. In addition, establishing a large number of correlations is dangerous, because various interactions between them might not be accounted for. These findings, therefore, are tenuous.
One statistically reliable insight in the research is that there is some degree of probability that increasing time in power results in higher corruption, as well as increasing negative effects for the country. This has been the case consistently across all variables. In addition, long ruling heads of state are associated with deeper structural damage to a country, and leave a legacy that does not easily go away when they are replaced by a less corrupt successor.
So how long is too long? The analysis suggests anything beyond 10 years is too long, because the effects discussed previously begin to be seen after a period of 10 years in office. Any period of office beyond 10 years begins to affect the country, setting up legacy effects that reverberate long after the head of state has been removed. With this in mind, it is interesting to consider the number of African leaders who are approaching ten-year threshold (see pp. 46-51).

Vaughan Dutton is a chartered research psychologist and associate fellow of the British Psychological Society, with 18 years’ social research experience gained at senior levels in commercial, government and academic contexts. He has taught social research methods, social theory and psychological theory at a number of universities in South Africa and the UK. Currently a consultant, he is also completing a doctorate in psychotherapy. He studied research psychology (applied social research) in South Africa, and holds a research doctorate from the University of Oxford.