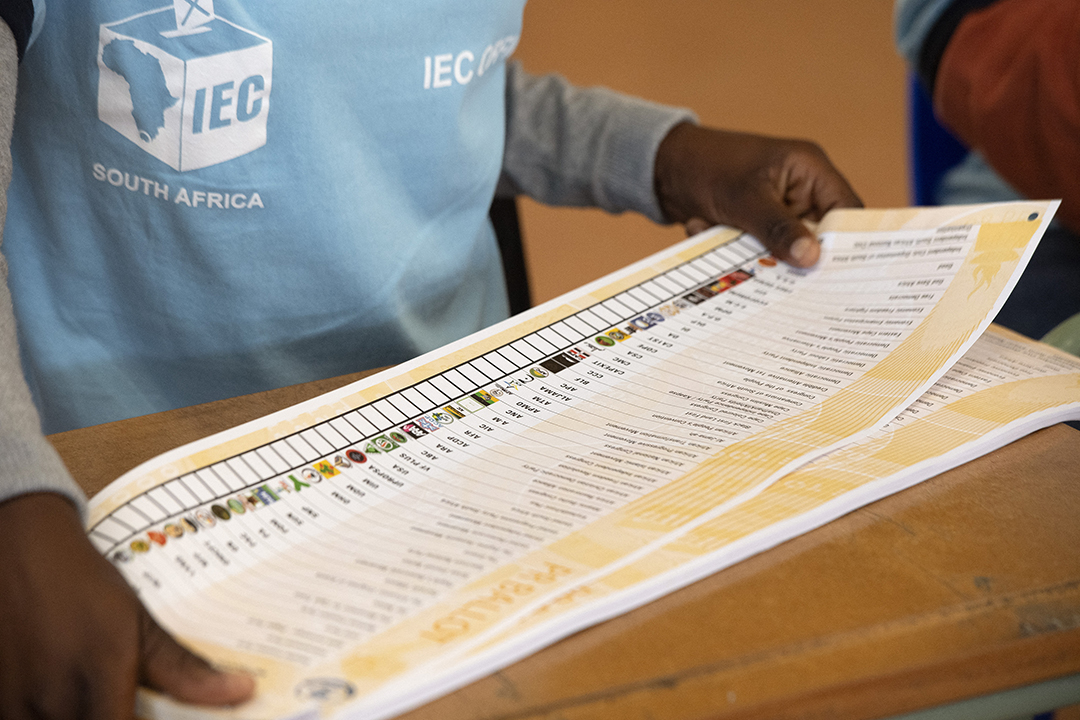
The Independent Electoral Commission (IEC) ballot paper in a polling station in Langa, near Cape Town, on 1 November 2021, during South Africa’s local government elections. Photo: Rodger Bosch/AFP
Introduction
The 2021 South African Local Government Elections (LGEs) saw the lowest voter turnout in the history of South Africa’s electoral democracy. Overall turnout for the election was recorded at 45.86%, and of the nine provinces, only the Northern Cape saw turnout exceed 50%. This is to say nothing of the millions of South Africans who chose to not register to vote in the first place. The election also saw a record number of municipal councils where no party gained an overall majority of seats, with the two largest political parties, the African National Congress (ANC) and the Democratic Alliance (DA) experiencing a notable decline in their respective vote shares relative to the 2016 LGEs.
Given this perilous state of affairs, we delved deeper into the data to consider whether some of the inter-provincial differences in voter turnout and electoral outcomes can be explained by the governance performance of municipal councils. To do so, we assessed whether the score for each of South Africa’s 205 local municipalities in GGA’s 2021 Governance Performance Index (GPI) helps to account for differences in voter turnout; changes in the performance of a controlling party; political turnover; and generating the result of a hung council. The results which we present are firmly located within the global body of research which seeks to identify the determinants of election outcomes, including voter turnout.
Voter turnout for the 2021 Local Government Elections
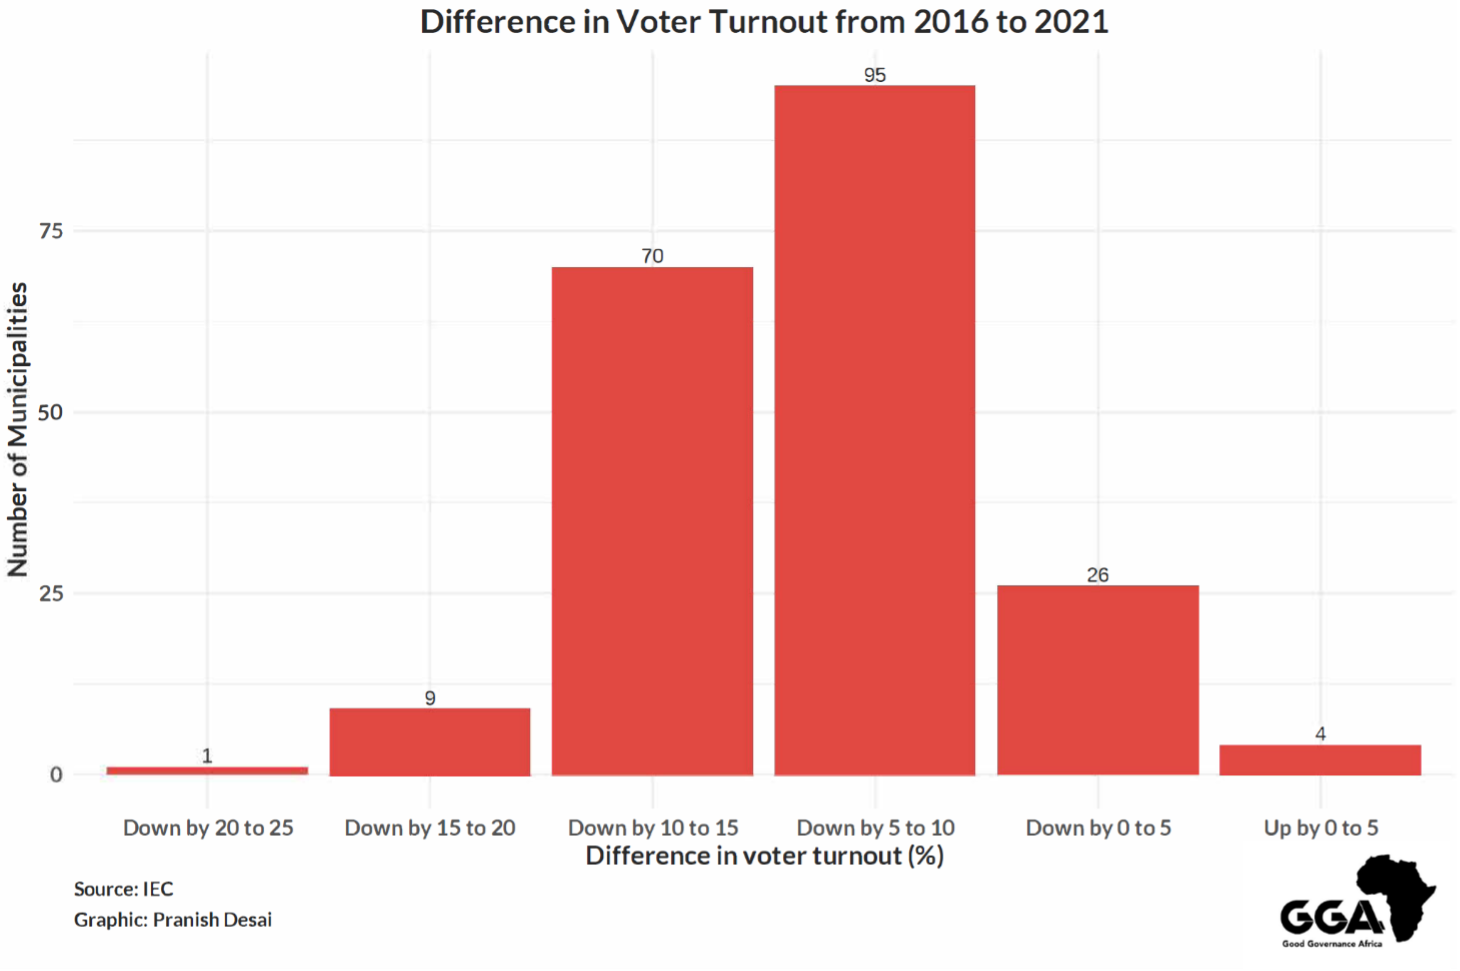
Overall national voter turnout was 45.86%, down from 57.94% in 2016. This headline figure masks the trends at the local municipal level itself. The chart below shows that among South Africa’s 205 local municipalities, voter turnout was down from 2016 levels in 201 municipalities. The four municipalities which recorded an increase in voter turnout were Collins Chabane and Maruleng in Limpopo, and Kamiesberg and Richtersveld in the Northern Cape. Mkhambathini local municipality in KwaZulu-Natal experienced the greatest downswing between elections, going from 63.91% in 2016 to 40.26% in 2021. Another data point that highlights the political shifts which occurred between elections was the vote share gained by the controlling party (the incumbent) in a municipality being down in 178 of the 205 local municipalities.
The GPI
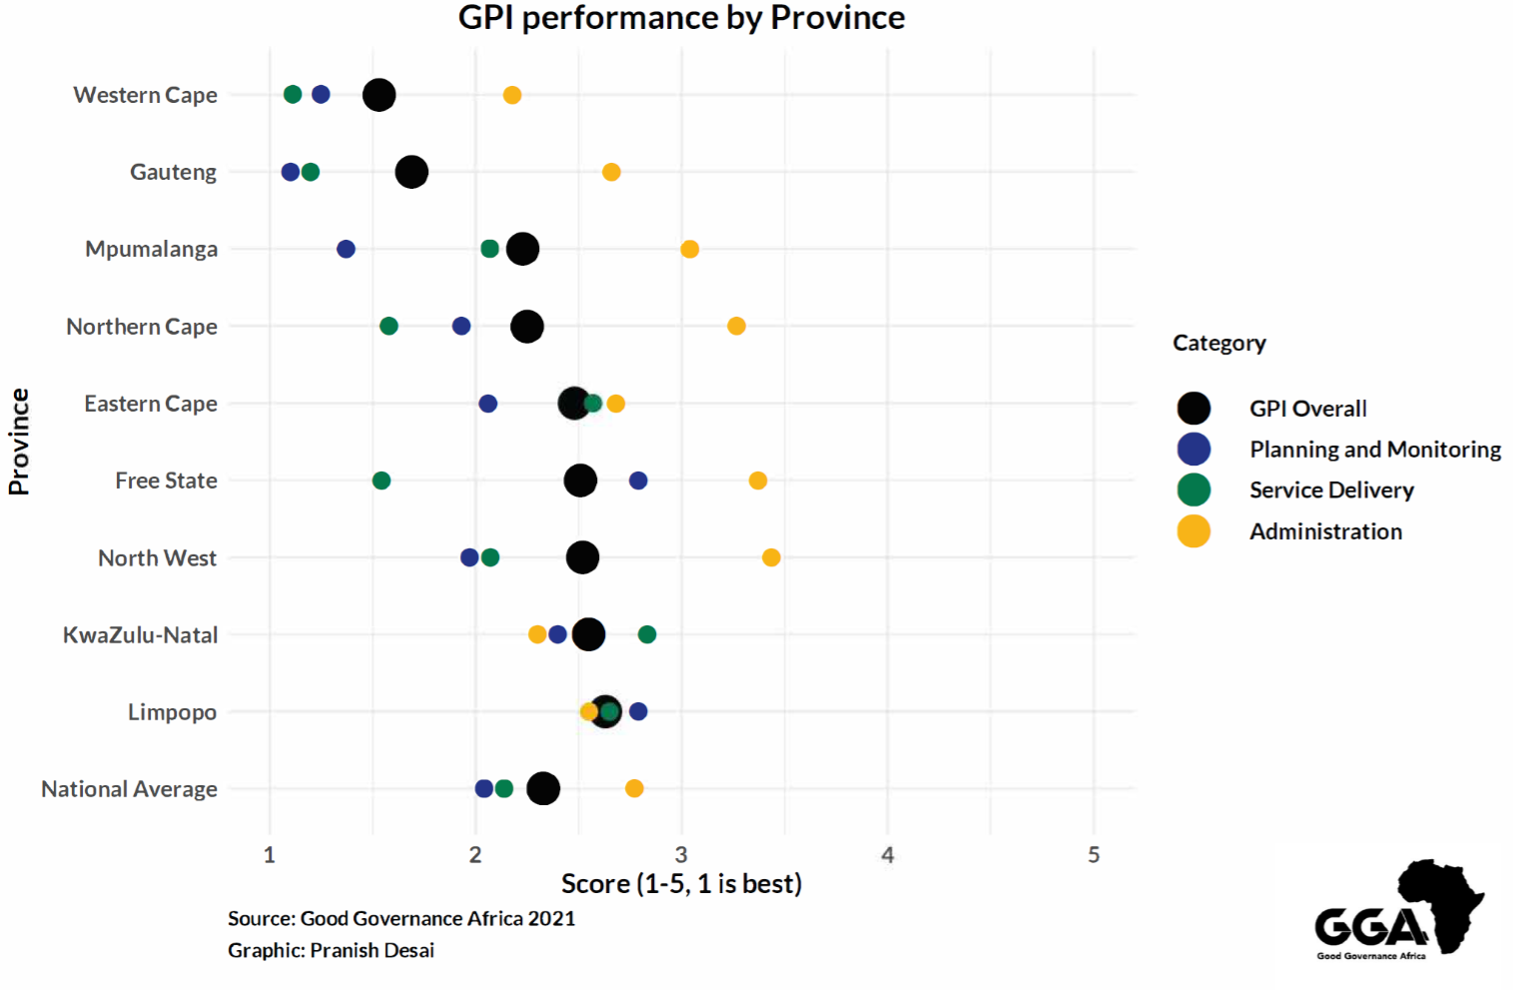
The 2021 GPI scored South Africa’s 205 local municipalities according to three governance categories: Administration, Planning and Monitoring, and Service Delivery (weighted most heavily in favour of the latter, given that service delivery is municipalities’ core constitutional mandate). The Administration category included indicators related to audit outcomes, financial soundness, and human resources management, while the Planning and Monitoring category scored municipalities on whether they had satisfactorily submitted required documents (such as annual plans) and whether they were adequately monitoring key aspects of service delivery quality (such as water quality and effluent discharge). The Service Delivery category examined how municipalities were performing in providing key services such as piped water, electricity, household sewerage systems and refuse removal. This category also measured the performance of municipalities in how they were executing in providing indigent households with free basic services, an important consideration given the inequalities which pervade South African life.
The top-ranked municipality in South Africa was Cape Agulhas in the Western Cape, while the bottom-ranked municipality was Msinga in KwaZulu-Natal. The figure below shows the distribution of scores across South Africa’s nine provinces, as well as the category and GPI averages for the country overall. As the figure demonstrates, lower scores on the GPI are better, and so the Western Cape was the best performing province while Limpopo was the worst performing province.
The GPI and election outcomes
We used regression models to understand whether local governance performance has an influence on four specific election outcomes (dependent variables): voter turnout, whether the vote share received by the controlling party in a municipality increased or decreased from 2016 to 2021, political turnover, and hung councils. Governance performance (independent variable) was measured using the scores obtained by municipalities in each of the three GPI categories mentioned above. The relationships between these independent variables and each of the four dependent variables were tested separately, so there are four models in total. As we specify below, we used multiple linear regression to test the relationship between governance quality and voter turnout. We used logistic regression to test the relationships between governance quality and the change in electoral performance by a controlling party in a municipality, governance quality and political turnover, and between governance quality and the emergence of a hung council in the post-election period.
We aimed to isolate and specify the impact of different elements of the GPI score on electoral outcomes, controlling for potential intervening variables such as urban/rural geographic location, matric completion rates, poverty, and employment levels. We also included a control variable which recorded whether a municipality was located in KwaZulu-Natal (KZN). This is because KZN was the scene of some of the most volatile electoral outcomes including experiencing one of the steepest declines in voter turnout since 2016 (13.28%), a sharp drop in the vote share gained by the ANC (16.35%) and a high proportion of hung councils (19 of 43) and instances of political turnover (22 of 43). The province was also the focus of much political analysis in the post-election period. In addition, KZN was the backdrop for the most turbulent looting and rioting in the aftermath of the arrest of former President Jacob Zuma in July 2021, an event which may have been a partial driver for the watershed election results which occurred within the province. The relationships were measured at the level of the 205 local municipalities for the 2021 LGEs. Due to different dynamics and data availability, the 8 metropolitan municipalities, and the 44 district municipalities were excluded from this analysis.
Data collection
The elections data used for this analysis has been gathered from the IEC, the data used for the control variables is from Statistics South Africa, while the measures of governance quality we used are from Good Governance Africa’s work on the 2021 GPI. This dataset is cross-sectional in that it focuses on municipal performance and electoral outcomes measured at a single point in time, namely during the 2021 LGEs.
Model specification
We employed Multiple linear (ML) regression modelling to understand relationships between a set of independent variables, and a continuous dependent variable:
- Dependent variable (voter turnout) and potential explanatory variables (service delivery, municipal administration and municipal planning and monitoring).
We used Logistic regression (LGR) to understand a series of relationships between a set of independent variables and dependent variables which represent an election outcome, which had one of three possible outcomes:
- Dependent variable (whether a party previously in charge of a municipality increased or decreased their share of the vote relative to the 2016 election) and potential explanatory variables (service delivery, municipal administration and municipal planning and monitoring).
- Dependent variable (political turnover) and potential explanatory variables (service delivery, municipal administration and municipal planning and monitoring). Political turnover refers to instances where the previously controlling party lost control of a municipality following the 2021 elections, whether by losing a previous majority, or by losing control of a municipality to another party which gained a majority.
- Dependent variable (hung council) and potential explanatory variables (Service delivery, municipal administration and municipal planning and monitoring). According to the IEC, a hung council is any municipal council where any one party has failed to gain more than 50% of seats within the municipal council.
In the next section, we report on the results of these regression models. The results only include the coefficients of the three independent variables.[1]
Results and interpretation of results (ML)
| Dependent variable: | Voter Turnout (Model 1) |
| Service Delivery | -1.306** |
| Planning and Monitoring | -0.112 |
| Administration | 0.051 |
| Constant | 77.769*** |
| Observations
R2 Adjusted R2 Residual Std. Error (df = 195) F Statistic (df = 12; 195) |
205
0.310 0.278 5.562 9.715*** |
| Note: | *p<0.1; **p<0.05; ***p<0.01 |
Based on the results of the regression analysis, a significant relationship (looking at p-values) exists between the dependent variable of voter turnout and the independent variable of service delivery. Scores in administration and planning and monitoring were not meaningful predictors of variations in voter turnout. At 0.31, the R-Squared in this model means that the model including the control variables is predicting 31% of the variation within the voter turnout. The rest of this variation is likely explained by other factors which this model doesn’t include such as historical voter turnout patterns, and voter-day specific issues such as the weather and the fact that the LGEs were held on a Monday (a public holiday). The implication of these results is that municipal performance in service delivery is one of the factors which influences differences in voter turnout at the local municipal level. It is worth remembering that GPI categories are measured on a scale where better performances received lower numerical scores (a score of 1 is better than a score of 5).
The coefficient for service delivery of -1.306 indicates that there is a direct relationship between service delivery outcomes and voter turnout. That is, better service delivery was linked with higher municipal-level voter turnout in the 2021 LGEs, while municipalities which had worse service delivery outcomes were more likely to experience lower voter turnout. Specifically, the coefficient size suggests that for every one-unit improvement in service delivery performance, we can also expect an increase in voter turnout of 1.306% within a municipality when controlling for other factors. This is to be expected, as voters appear more likely to be convinced that their votes matter when they see service delivery improvements. By contrast, the links between administration and voter turnout, and planning and monitoring and voter turnout are very weak, as is seen in the fact that neither of the coefficients exceed ± 0.15; hence the lack of statistical significance attached to these results. One conclusion we can draw from lower quality service delivery being linked with lower voter turnout is that part of the explanation for low turnout is disillusionment, indifference, or a sense of futility (the belief that voting won’t make any difference) amongst the electorate due to their concerns over a lack of adequate service delivery provision. This is a portentous finding in the context of the health of South Africa’s electoral democracy.
Results and interpretation of results (LGR)
| Dependent variable: | Direction changes of vote share of controlling party (Model 2) |
| Service Delivery | 0.456 |
| Planning and Monitoring | 0.043 |
| Administration | -0.304 |
| Constant | -1.125 |
| Observations
Log Likelihood Akaike Inf. Crit. Residual
|
205
-75.562 171.123 |
| Note: | *p<0.1; **p<0.05; ***p<0.01 |
Model 2 used logistic regression to test the relationship between the GPI categories and a binary coded variable which recorded whether the vote share which was garnered by the party which held control of a municipal council increased or decreased between the 2016 and 2021 LGEs. In this model, the three GPI categories are not statistically meaningful predictors of this variation. The coefficient between planning and monitoring and vote share difference (-0.304) suggests that there is a correlation between better performances in this governance category and an increase in the vote share received by a controlling party between the 2016 and 2021 LGEs.
More surprising, though, is the implication of the coefficient for the relationship between service delivery and vote share difference (0.456). This result indicates that while no causal relationship exists, there is a slight correlation between worse service delivery outcomes and the likelihood that a party increased its vote share between the two elections. This confounding finding is mainly explained by the fact that the controlling party only gained a higher vote share (than in 2016) in 27 municipalities compared to the 178 where they did worse – an uneven outcome sample. The average score on the service delivery category of municipalities where the controlling party did better than in 2016 was 2.17, something which exceeds the performance of municipalities where controlling parties did worse (2.10), and the overall national average on this indicator (2.11). Almost all this variation is explained by the performances of controlling parties which improved their vote share in KwaZulu-Natal. In 6 KZN municipalities the controlling party improved its electoral performance, and the average service delivery score in these municipalities was 3.56, far worse than the national average. If one were to exclude these 6 municipalities, then the average service delivery score in municipalities where the controlling party increased its vote share drops to 1.77, indicating far better service delivery outcomes than municipalities where the controlling party decreased in vote share. If we exclude these 6 municipalities from the analysis, then the coefficient moves closer to zero, and the relationship remains non-significant.
| Dependent variable: | Political Turnover 2021 (Model 3) | Hung Council 2021 (Model 4) |
| Service delivery | -0.729* | -0.85** |
| Planning and Monitoring | -0.016 | 0.031 |
| Administration | 0.032 | -0.029 |
| Constant | 3.494 | 6.126*** |
| Observations
Log Likelihood Akaike Inf. Crit. Residual |
205
-90.482 200.963 |
205
-92.248 204.496 |
| Note: | *p<0.1; **p<0.05; ***p<0.01 | *p<0.1; **p<0.05; ***p<0.01 |
Both the occurrence of political turnover and the result of a hung council, which are the dependent variables in two of the Logistic regression (LGR) models, are significantly linked with service delivery, but not with administration or planning and monitoring. Based on the results of model 3, there is a statistically meaningful negative relationship between service delivery and political turnover (-0.729). Given that lower scores on the GPI represent better governance outcomes, this means that better performance on service delivery outcomes is actually linked with the greater likelihood of political turnover – that is, a situation where the controlling party loses a majority either through the result of a hung council, or by losing the majority to another party. It is a similar case when considering the relationship between service delivery and the result of a hung municipality as reported by model 4. There is a meaningful relationship between service delivery and the occurrence of a hung council (-0.85). What this means is that improved service delivery is an important predictor of there being a greater probability of a hung council within a municipality. Across the two models, there are very weak correlations between the categories of administration and planning and monitoring with political outcomes such as hung councils and political turnover.
On the surface, the result linking better service delivery with a higher likelihood of political turnover and a higher likelihood of a hung council is counterintuitive. This is because one would expect that better governance quality, especially in service delivery, would reduce political turnover, and reduce the likelihood of a hung council, as voters reward those in charge of better governed municipalities for good governance by returning them to power. However, in the South African context, factors such as historical voting patterns often defy expectations that one might associate with more mature democracies. A case in point is Cape Agulhas Local Municipality, the best-performing municipality in the country according to our GPI. During the 2021 LGEs, this municipality experienced political turnover as the previous controlling party (the DA) lost its majority with its vote share dropping from 53.31% to 44.04%, resulting in a hung council. The return to power by the DA within this council relied on the support of the FF Plus, which holds one seat on the Cape Agulhas municipal council. This type of dynamic is present across the country during this post-election period. The overall implication of the results we presented is that while improved service delivery is one of the drivers of higher voter turnout at the municipal level, it is not necessarily the case that this rewards the incumbent party.
The way forward
What this analysis has demonstrated is that aspects of municipal performance – especially in areas of service delivery – are relevant when considering election outcomes such as voter turnout, political turnover, and the occurrence of a hung council at the level of the 205 local municipalities. These results, especially the link found between adverse governance quality and lower voter turnout are imperative to understand in the aftermath of an election which saw the lowest turnout in South Africa’s democratic history. This is because a core aspect of our democracy, active political participation through voting, is on the decline partly because of the poor local governance outcomes which afflict large portions of the country. And while the analysis found weak links between performance in the GPI categories, and changes in the support received by controlling parties, it remains essential that political parties which have been given the responsibility to govern by the electorate do so in a responsible and effective way which deals with the local government issues which daily affect people’s lives. Doing this is not simply a matter of partisan interest, but of something more important, namely, the continued survival of our electoral democracy, especially at the local level.
- For brevity’s sake, we do not report the relationships between the various control variables and each dependent variable in this report. The full set of regression results are available by email. Please send a message to Pranish Desai (pranish@gga.org), or Sixolile Ngqwala (sixolile@gga.org) for further engagement.

Pranish Desai is a doctoral student in political science at the Massachusetts Institute of Technology. His core areas of focus are in comparative politics and political methodology, with a specific interest in the politics of Southern Africa. Between 2021 and 2024, Pranish held several key positions within the Governance Insights and Analytics programme at GGA. In these roles, he was centrally responsible for the elevation and enhancement of the Governance Performance Index as GGA's flagship governance assessment tool. Before departing GGA, Pranish also played a key role in the development of our strategic framework for the 2024-2028 period.

Sixolile Ngqwala holds a Master of Commerce (MCom) in Economics from the University of Fort Hare, where he worked on the National Income Dynamics study (NIDS), based at the University of Cape Town, for Econometric research (econometric modelling, data coding, data mining, data analysis and interpretation). Sixolile has two BCom undergraduate degrees (in economics and in business financial management and industrial psychology). For his BCom Honours he majored in econometrics and economics. He has multidisciplinary skills, including an intersection of machine learning and data science (PYTHON and R-programming). Sixolile has background experience in natural resources, working with AngloGold Ashanti in the finance department. Later, he joined CNH-Industrial as a junior strategic developer and government relations. In 2019 he joined Good Governance Africa as a lead researcher, where he is responsible for quantitative and qualitative data management and statistical analysis on research projects relating to natural resources, land reform, and policy analysis, among others. At university he was involved in starting an academic society, New Economic Horizon, that fostered a working relationship between the Auditor-General’s office in the Eastern Cape and the University of Fort Hare’s accounting department.